
 Brent Schowe

"Time is money.” That short phrase says a great deal about the preciousness of time, but it also neatly describes the concept of interest rates.
Simply put, an interest rate is the fee (stated as an annual percentage) that a borrower pays for the privilege of borrowing a dollar now and paying it back later. And if time is indeed money, then more time is more money. So, it seems quite logical — and in keeping with literally thousands of years of financial history — that a borrower would have to pay a higher rate of interest the longer he or she wants to wait to pay that dollar back. The longer the wait, the greater is the chance that something goes wrong with the borrower — or with the world in general. That dollar may not be paid back at all. Or if it is, inflation may make that dollar worth a lot less in the future. Much can happen in one year, but a great deal can happen in 5, 10, or 30 years.
Because of all this uncertainty about the future, lenders and investors consistently demand higher interest rates to lock up their money for ever-longer of periods of time. This “term structure” of interest rates is commonly displayed by what is known as a “yield curve,” where interest rates, or yields, are plotted against a security’s term to maturity. Perhaps the most followed yield curve in the world is the one that plots the yields available on the various maturities of U.S. Treasury securities. A “normal” Treasury yield curve is upward sloping, confirming the concept that even Uncle Sam must pay higher rates the longer that he wants to tie up a bondholder’s money. The slope of the Treasury yield curve has varied significantly over time, depending on a host of economic and market factors, but only in rare instances does the yield curve “invert,” or offer short-term rates that are higher than long-term rates. We are living in such a period today.
An Inverted Yield Curve Is Unusual — and Ominous
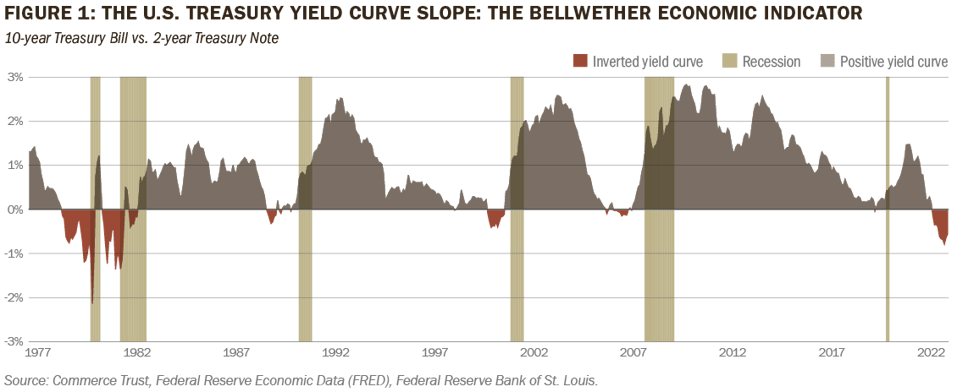
Various measures of the yield curve’s slope are used by researchers and market participants, but the most widely cited slope is the one that measures the difference between the yields of 10-year and 2-year Treasury securities. Figure 1 shows the 10-year/2-year slope dating back to 1977 — the period over which we have the most comprehensive daily data.
Overlaid on the chart are shaded bars that represent official periods of recession as designated by the National Bureau of Economic Research (NBER), a private research organization dedicated to understanding how the economy works. The chart shows that an inverted yield curve has preceded all six U.S. recessions experienced over this time frame. Even our most recent recession, which was triggered by the global COVID-19 pandemic, was indeed preceded by a period of seven trading days in late August 2019 where 10-year yields were slightly below 2-year yields.

In this most recent instance, the 10-year/2-year slope first briefly inverted in April 2022 and spent the next three months in slightly positive territory before inverting for good on July 5, 2022. It reached a peak inversion of over 1% during the week of Silicon Valley Bank’s collapse in early March 2023 and sits at around 0.50% here in early May.
Why Inversions are Good Recession Indicators
Yield curve inversions appear toward the end of business cycles, as the economy shows signs of overheating. Low unemployment and rising inflation are often the hallmarks of this environment. During periods of overheating, the Federal Reserve (Fed) acts to raise the federal funds rate, or the overnight rate that banks pay to borrow from other banks. As the impact of the Fed’s rate hikes begins to weigh on the economy, investors factor in the potential for the slowdown in growth to translate into lower interest rates in the future. Treasury yields further “out the curve” therefore drop in anticipation of short-term rates eventually following suit. Should short-term rates remain stubbornly high as long-term rates continue to fall, the “flattening” yield curve is signaling that the Fed is quite literally “behind the curve” and risks tipping the economy into recession. Ideally, the Fed would reverse course and lower the federal funds rate at precisely the time required to avoid recession — and without reigniting the inflationary pressures it was combatting in the first place. When successful, such a maneuver has been coined a “soft landing,” an almost mythical monetary feat that has been engineered only a handful of times since the 1970’s. The opposite of a soft landing is… quite obviously… a hard landing, or a recession.
What Prior Inversions Can (and Can’t) Tell Us About Today’s Inversion
In a sense, recessions are never avoidable. The business cycle cannot be repealed, despite the concerted efforts and best intentions of policymakers, politicians, businesses, and consumers. Recessions will inevitably follow expansions. And each business cycle is unique, with unique sources of boom and bust and unique policy responses that result. Just consider the last three recessions we’ve experienced. The most recent one was triggered by a global pandemic that killed millions and put our economy into a freefall — for all of two months.
The previous one started from a housing bubble burst that nearly brought down the global financial system. It lasted 18 months from 2007 to 2009, earning the nickname of the “Great Recession.” Looking further back in recent history, we have the “dot.com bubble” in 2001, which was arguably the mildest recession we’ve ever had. Unfortunately, the depth and duration of the yield curve inversions that preceded them offered no clues to the depth and duration of the recessions that followed.
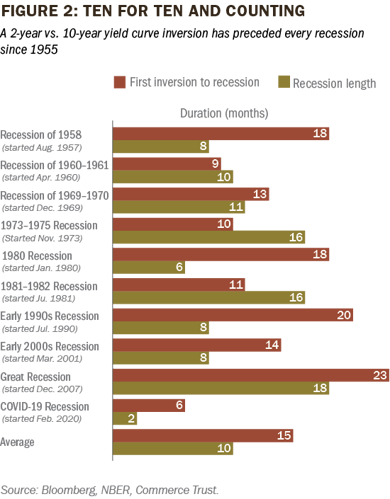
Nonetheless, we dug deeper into some data points going back to the mid-1950s to add four more entries to our sample size of recessions and yield curve inversions, hoping to gain more insight into the highs and lows and the leads and lags. (see Figure 2) Again, we find that inverted yield curves preceded all U.S. recessions. The average lead time before the onset of recession was 14 months, with a minimum of 6 months and a maximum of 23 months. Interestingly, those two bookends of lead time represent our two most recent recessions, substantiating the outlier status of the pandemic and the Great Recession.
Our Outlook and Approach
Our analysis largely confirms a growing consensus among investors that a recession is looming not all that far over the horizon. Beyond the single variable of a yield curve slope, other key leading economic indicators — consumer expectations, new orders, building permits — are also pointing to a downturn ahead. And the tightening of credit conditions since this year’s spate of regional bank failures has only added to the chorus of alarm. Of course, predicting the precise start of the next recession is virtually impossible. But even if we use the longest historical lag between the onset of a yield curve inversion and the onset of a recession since 1955 (23 months), the U.S. would find itself in recession no later than the first quarter of 2024. However, the current employment situation could suggest “this time is different.” (Those might be the four most dangerous words in economic forecasting.)
Employment is a lynchpin in NBER’s determinations on whether the economy is in expansion or recession, so the resilience of the current labor market keeps the possibility of a soft landing alive.
However, the Fed’s most recent increase of the federal funds rate on May 3 — the 10th rate hike in 14 months — brought the fed funds target range to 5.00–5.25%, and has us increasingly convinced that a bumpy landing could be ahead as businesses eventually reassess their hiring plans. As such, we prefer maintaining a defensive posture from a portfolio management perspective. This includes a bias toward investment grade bonds, looking for the opportunity to add duration and maturity while minimizing exposure to lower-quality credit instruments. We also favor allocation to cash for capital preservation to be in position to add back to stocks and other riskier assets as the economic outlook becomes clearer.
An Inverted Yield Curve Is Unusual — and Ominous
Various measures of the yield curve’s slope are used by researchers and market participants, but the most widely cited slope is the one that measures the difference between the yields of 10-year and 2-year Treasury securities. Figure 1 shows the 10-year/2-year slope dating back to 1977 — the period over which we have the most comprehensive daily data.
Overlaid on the chart are shaded bars that represent official periods of recession as designated by the National Bureau of Economic Research (NBER), a private research organization dedicated to understanding how the economy works. The chart shows that an inverted yield curve has preceded all six U.S. recessions experienced over this time frame. Even our most recent recession, which was triggered by the global COVID-19 pandemic, was indeed preceded by a period of seven trading days in late August 2019 where 10-year yields were slightly below 2-year yields.
In this most recent instance, the 10-year/2-year slope first briefly inverted in April 2022 and spent the next three months in slightly positive territory before inverting for good on July 5, 2022. It reached a peak inversion of over 1% during the week of Silicon Valley Bank’s collapse in early March 2023 and sits at around 0.50% here in early May.
Why Inversions are Good Recession Indicators
Yield curve inversions appear toward the end of business cycles, as the economy shows signs of overheating. Low unemployment and rising inflation are often the hallmarks of this environment. During periods of overheating, the Federal Reserve (Fed) acts to raise the federal funds rate, or the overnight rate that banks pay to borrow from other banks. As the impact of the Fed’s rate hikes begins to weigh on the economy, investors factor in the potential for the slowdown in growth to translate into lower interest rates in the future. Treasury yields further “out the curve” therefore drop in anticipation of short-term rates eventually following suit. Should short-term rates remain stubbornly high as long-term rates continue to fall, the “flattening” yield curve is signaling that the Fed is quite literally “behind the curve” and risks tipping the economy into recession. Ideally, the Fed would reverse course and lower the federal funds rate at precisely the time required to avoid recession — and without reigniting the inflationary pressures it was combatting in the first place. When successful, such a maneuver has been coined a “soft landing,” an almost mythical monetary feat that has been engineered only a handful of times since the 1970’s. The opposite of a soft landing is… quite obviously… a hard landing, or a recession.
What Prior Inversions Can (and Can’t) Tell Us About Today’s Inversion
In a sense, recessions are never avoidable. The business cycle cannot be repealed, despite the concerted efforts and best intentions of policymakers, politicians, businesses, and consumers. Recessions will inevitably follow expansions. And each business cycle is unique, with unique sources of boom and bust and unique policy responses that result. Just consider the last three recessions we’ve experienced. The most recent one was triggered by a global pandemic that killed millions and put our economy into a freefall — for all of two months.
The previous one started from a housing bubble burst that nearly brought down the global financial system. It lasted 18 months from 2007 to 2009, earning the nickname of the “Great Recession.” Looking further back in recent history, we have the “dot.com bubble” in 2001, which was arguably the mildest recession we’ve ever had. Unfortunately, the depth and duration of the yield curve inversions that preceded them offered no clues to the depth and duration of the recessions that followed.
Nonetheless, we dug deeper into some data points going back to the mid-1950s to add four more entries to our sample size of recessions and yield curve inversions, hoping to gain more insight into the highs and lows and the leads and lags. (see Figure 2) Again, we find that inverted yield curves preceded all U.S. recessions. The average lead time before the onset of recession was 14 months, with a minimum of 6 months and a maximum of 23 months. Interestingly, those two bookends of lead time represent our two most recent recessions, substantiating the outlier status of the pandemic and the Great Recession.
Our Outlook and Approach
Our analysis largely confirms a growing consensus among investors that a recession is looming not all that far over the horizon. Beyond the single variable of a yield curve slope, other key leading economic indicators — consumer expectations, new orders, building permits — are also pointing to a downturn ahead. And the tightening of credit conditions since this year’s spate of regional bank failures has only added to the chorus of alarm. Of course, predicting the precise start of the next recession is virtually impossible. But even if we use the longest historical lag between the onset of a yield curve inversion and the onset of a recession since 1955 (23 months), the U.S. would find itself in recession no later than the first quarter of 2024. However, the current employment situation could suggest “this time is different.” (Those might be the four most dangerous words in economic forecasting.)
Employment is a lynchpin in NBER’s determinations on whether the economy is in expansion or recession, so the resilience of the current labor market keeps the possibility of a soft landing alive.
However, the Fed’s most recent increase of the federal funds rate on May 3 — the 10th rate hike in 14 months — brought the fed funds target range to 5.00–5.25%, and has us increasingly convinced that a bumpy landing could be ahead as businesses eventually reassess their hiring plans. As such, we prefer maintaining a defensive posture from a portfolio management perspective. This includes a bias toward investment grade bonds, looking for the opportunity to add duration and maturity while minimizing exposure to lower-quality credit instruments. We also favor allocation to cash for capital preservation to be in position to add back to stocks and other riskier assets as the economic outlook becomes clearer.
Download the Article
The Chartered Financial Analyst® (CFA®) Charter is a designation granted by CFA Institute to individuals who have satisfied certain requirements, including completion of the CFA Program and required years of acceptable work experience. Registered marks are the property of CFA Institute.
Past performance is no guarantee of future results, and the opinions and other information in the commentary are as of May 12, 2023. This summary is intended to provide general information only and is reflective of the opinions of Commerce Trust. This material is not a recommendation of any particular security, is not based on any particular financial situation or need and is not intended to replace the advice of a qualified attorney, tax advisor or investment professional.
Diversification does not guarantee a profit or protect against all risk. Commerce Trust does not provide tax advice or legal advice to customers. Consult a tax specialist regarding tax implications related to any product and specific financial situation. Data contained herein from third-party providers is obtained from what are considered reliable sources. However, its accuracy, completeness or reliability cannot be guaranteed.
INVESTMENT PRODUCTS: NOT FDIC INSURED | MAY LOSE VALUE | NO BANK GUARANTEE COMMERCE TRUST IS A DIVISION OF COMMERCE BANK.